Maritime Focused Excel and Power BI Course
 Speakers :
 Seats :
Completed
 Date & Time :
 Price :
Duration :
Price :
Duration :
Event Sessions
Content On Trainings
WHY DATA ANALYTICS?
Data analysis is the compass steering operations, optimizing voyages, and curbing emissions, a critical tool enhancing safety, logistics, and decision making. By harnessing data, professionals navigate challenges, steering the industry toward a more sustainable and resilient future.
WHO SHOULD ATTEND THIS COURSE?
- Junior Officers / Engineers
- Operational level officers and Engineers
- Senior Officers / Engineers
- Management level officers and Engineers
- Mariner and Technical superintendent and Manager
PROGRAM SYLLABUS (MS EXCEL)
SESSION 1: (23rd March - 3 Hrs)
Working with Functions
Basic functions:(Sum + Average + Max +Min +Count)
Working with referencing
Cell addressing/referencing methods (Absolute + relative + mixed + range ..and more)
Logical functions
If + IFError + And + Or +Not + Nested IFs +
Utilize Formatting features
Conditional formatting
Assignment / Exercise
SESSION 2: (24th March - 3 Hrs)
Database management in excel
Static/Range and Dynamic Database Concepts +Tables+ Sort + Filter
Statistical functions
(SumIf + SumIfs +AverageIf + AverageIfs + CountIf +CountIfs)
Name manager
Naming the range + Using the name range in formulas
Data validation
Creating and working with lists, dependent lists
Creating custom validation, handling input, and error alerts
Cell & workbook protections
Assignment / Exercise
SESSION 3 : (30th March - 3 Hrs)
Text to Column Concepts
Text and Date/Time Calculations in Excel.
Look Up Reference functions
VLookup + Reverse Vlookup + Vlookup with IF + Vlookup with Indirect +Vlookup with IFError + HLookup +Index + Match + Wildcards in Vlookup
Assignment / Exercise
SESSION 4 : (31st March - 3 Hrs)
Remove Duplicates + Import/Export Data + Flash Fill + Concatenate +Transpose
Working with charts
Different Types, Creating Excel Charts, Pivot Charts
Formatting, Design, and Layout of the Chart
Creating, Applying, and Removing Chart Templates, Sparkline, and
Dynamic Charts
Working with Pivot Tables
Introduction & creation of pivot tables
Overview & review of the assignments given
Debriefing & how you could continue using Excel after the course.
PROGRAM SYLLABUS (Power BI)
SESSION 1 : (6th April - 2 Hrs)
- Introduction To Power BI
- Why Power BI
- Power BI Vs Excel
- Installing Power BI Desktop
- About the Project.
2. Getting Started
- Settings
- Power BI interface
- Canvas settings
3. Connecting & Shaping Data
- Type of data connectors
- Query editor tools
- Data categories
- Defining hierarchies
- Creating a rolling calender
4. Say Hi! to DAX
- Calculated columns
- Measures Quick
- measures Basic
- Math calculations
5. Creating Relationship in model view.
- Many to Many
- One to many
- Cross filter direction
SESSION 2: ( 7th April - 2Hrs)
6. Building Reports
- The Power BI report view
- Inserting objects & basic charts
- Formatting options.
- Filtering options
- Managing interactions
- Adding and Linking bookmarks & buttons
- “What if” parameters
- Importing custom visuals
- Preparing reports using Canva / Power Point.
7. Managing Power BI
- Data refreshing
- Sharing reports
- Some best practices
Final Assignment
- Doubt clearing Sessions
- Report presentation
Bonus Add-On
Integrating Chat-GPT with Excel and Power BI
- The AI World
- Prompt engineering (Tips & best practices)
- Chat GPT for Excel
- Chat GPT for Power BI
PLEASE NOTE:
Please Note :
8th and 10th April - Doubt clearing session (1 Hrs each)
13th April - Assignment presentation by all candidates
If interested, please email education@seaandbeyond.com or connect at +91 89288 96420.
Regards,
Sea and Beyond Team.
About the Speakers

Capt. J.S Parhar
Master mariner,He is a master mariner with more than 25 years of experience. He has sailed with P&O, Mitsui, Zodiac, K Line, Nakilat and has been using excel for past 23 years. He has sailed on Capesize Bulk / LPG and LNG vessels. He is someone who has learned excel through his own drive and much before google came into vogue. He has used excel to make GHA calculations, stability calculations, has extensively used Macros V-looks to make life easy on board a vessel for himself and for his colleagues.

Mr. Gourav Kullu
Master Mariner,He is a master mariner with 21 years of sailing experience on oil tankers. He also has 2 plus years of experience as a marine faculty. Currently, he is working as an independent consultant doing navigation audits and Remote VDR analysis and provides solutions to clients with extensive use of Power BI. He has also completed a course from Maven Analytics on Microsoft Power BI desktop for Business Intelligence.
In addition, being an NISM-certified personnel, he uses Power BI to optimize his trading strategy to meet his investment goals.
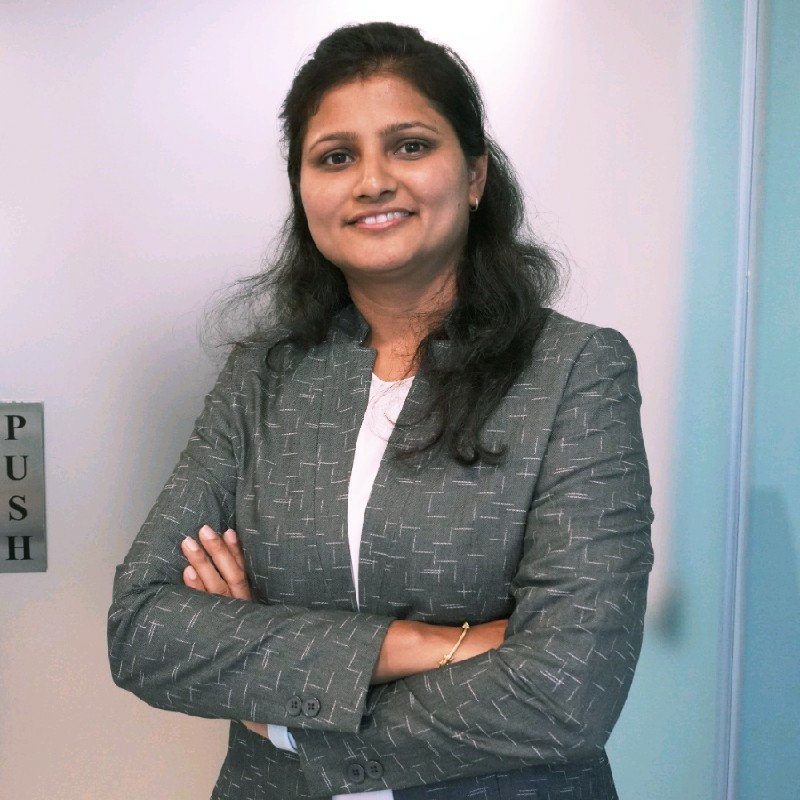
Jayshree Tawari
Trainer & Educator | Advance Excel | Power BI |,Freelance Advanced Excel trainer and other MS-Office technologies with 8+ years of Experience. She has imparted training on Advanced Excel, Professional PowerPoint, Power BI, Python.
She Has strong hands on analysis of data and Knowledge of various analysis tools available in Excel, inspired her towards the training for Excel to working professional, as data is important integral part of business and plays key role in taking decision for the growth of business.
she is also regular visiting faculty of ICAI (The Institute of Chartered Accountants of India), Pune

Sudharsan Rajendran
Senior Fleet Performance Analyst Synergy Marine Group,I bring over 11 years of dedicated experience in the Marine Industry, specializing in vessel performance analysis and sustainable shipping practices. As an Active SME, contributing to the Product development and data science solutions and played a key role in optimizing Voyage, fuel, emissions and ESG monitoring.
Similar Trainings
Career Opportunities For Turk...
Capt. Amarinder Brar
Career Transition – What Shou...
Capt. Harsh Johari
Career Transition For Mariners
Capt. Harsh Johari
Certification Course On Angel...
Anchal Taatya, Saurabh Kumar,
Find Your Pole Star
Capt. Harsh Johari
Leveraging LinkedIn
Capt. Harsh Johari
Maritime Writing: From Writin...
Capt. V.S Parani
Masterclass On Angel Investme...
Anchal Taatya, Saurabh Kumar,
MSc Shipping Operations & Man...
Dr. Antonis Violaris
Simplified Hydrodynamics And ...
Capt. Puneet Malhotra
Maritime Focused Intermediate...
Shobha M, Capt. J.S Parhar,
Find Your Pole Star Bootcamp 2.0
Capt. Harsh Johari
Maritime Informatics - Introd...
Jussi Poikonen, Wolfgang Lehmacher,
Introduction to Finance for S...
Mr. Vinay Naidu
Intro course on Finance for S...
Mr. Vinay Naidu
Maritime Focused Advanced Exc...
Capt. Gaurav Rana, Shobha M,
Maritime Focused Power BI Course
Capt. Gaurav Rana, Shobha M,
Maritime Focused Advanced Exc...
Capt. Gaurav Rana, Shobha M,
MCA UK OOW Orals preparation
Capt. Sherry
MCA UK Master Orals Preparation
Capt. Sherry
MCA UK Chief Mate Orals Prepa...
Capt. Sherry
Maritime Focused Advanced Exc...
Capt. J.S Parhar, Jayshree Tawari,
Maritime Focused Power BI Course
Mr. Gourav Kullu
MCA UK COC Class 2 - Oral and...
Oceanlink MariTime ...
Advanced Course on Commercial...
Capt. Ashok Sharma, Dr. Abhay Singh Thakur,
Maritime Focused Excel and P...
Mr. Gourav Kullu, Jayshree Tawari,
Maritime Focused Advanced Exc...
Jayshree Tawari
Maritime Focused Power BI course
Mr. Gourav Kullu
Advanced Course on Commercial...
Capt. Ashok Sharma, Dr. Abhay Singh Thakur,
ICS Exam Tutorials: Shipping ...
Capt. Gaurav Rana
ICS Exams Tutorials - Tanker ...
Capt. Gaurav Rana
ICS Exams Tutorials - Introd...
Capt. Gaurav Rana
Maritime Focused Excel and P...
Jayshree Tawari, Tiju Chandy,
Maritime Focused Advanced Exc...
Jayshree Tawari, Tiju Chandy,
Maritime Focused Power BI cou...
Mr. Gourav Kullu
Shipping Disputes and Prevent...
Mr. Jagmeet Makkar
Digital Transformation For Ma...
Uttam Kumar, Capt. Shailesh Bham...,
Maritime Focused Advanced Exc...
Jayshree Tawari
Maritime Focused Power BI cou...
Aaquib Jawed
Maritime Focused Excel and P...
Jayshree Tawari, Aaquib Jawed,
Testimonials from our customers...
See allGive your career a boost with S&B professional services.
CV Prep/EvaluationMore Jobs
Ship management
Mumbai
Electrical Superintendent
Ports and Pilotage
Mombasa, Kenya
AGM / DGM
Agency and Logistics
Dubai
Director Operations
Interview Prep/Mentoring
Find your polestar with the host of experts available on our platform
Know more

Contact Us